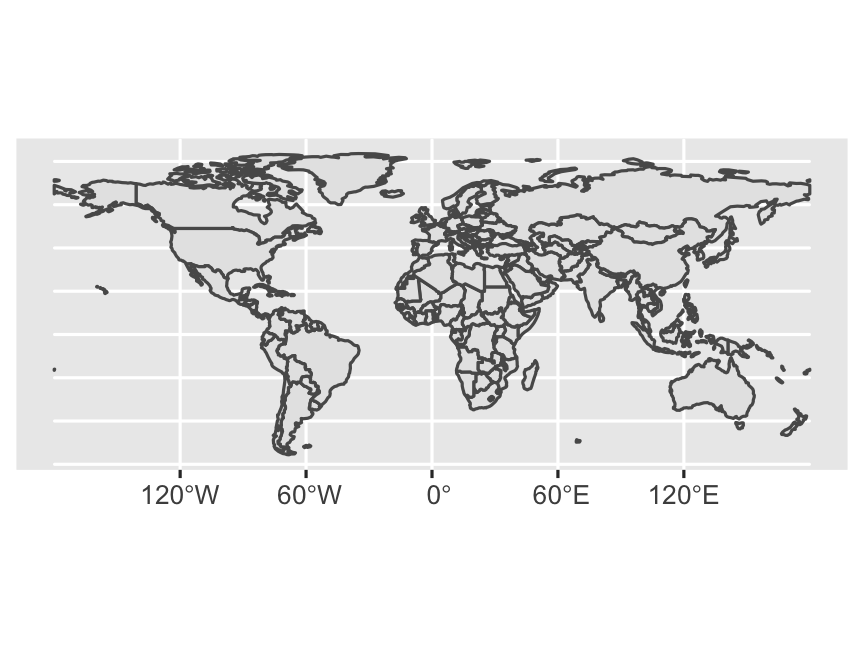
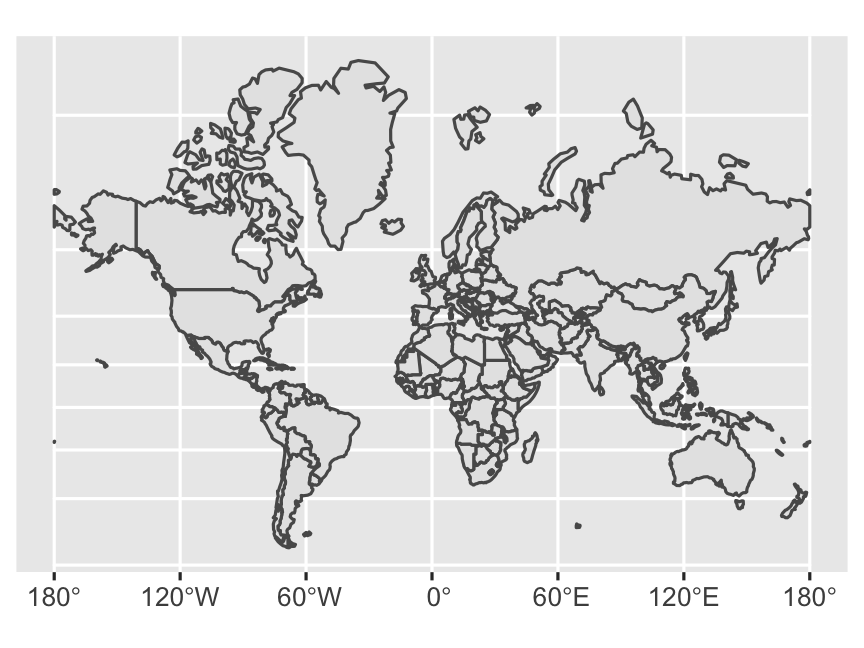
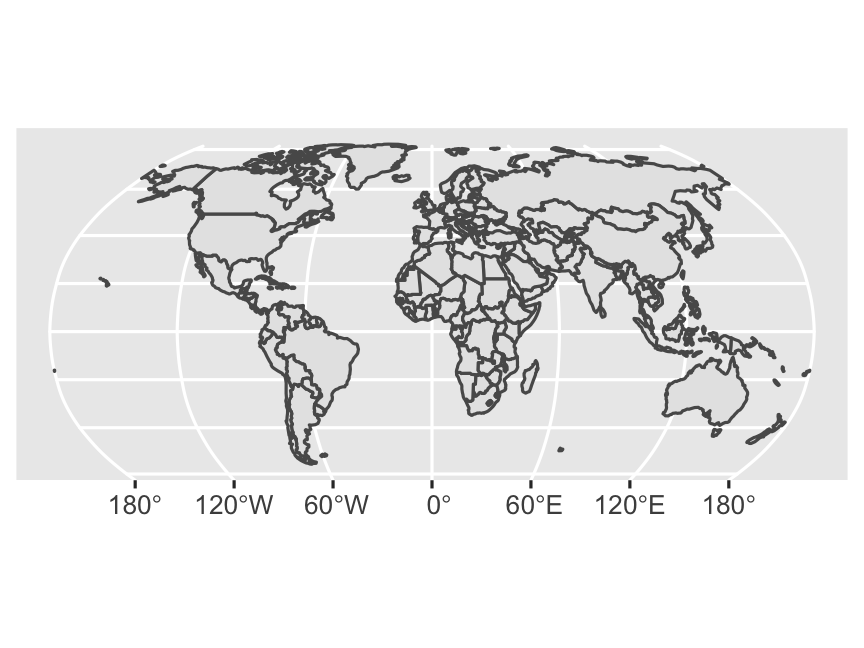
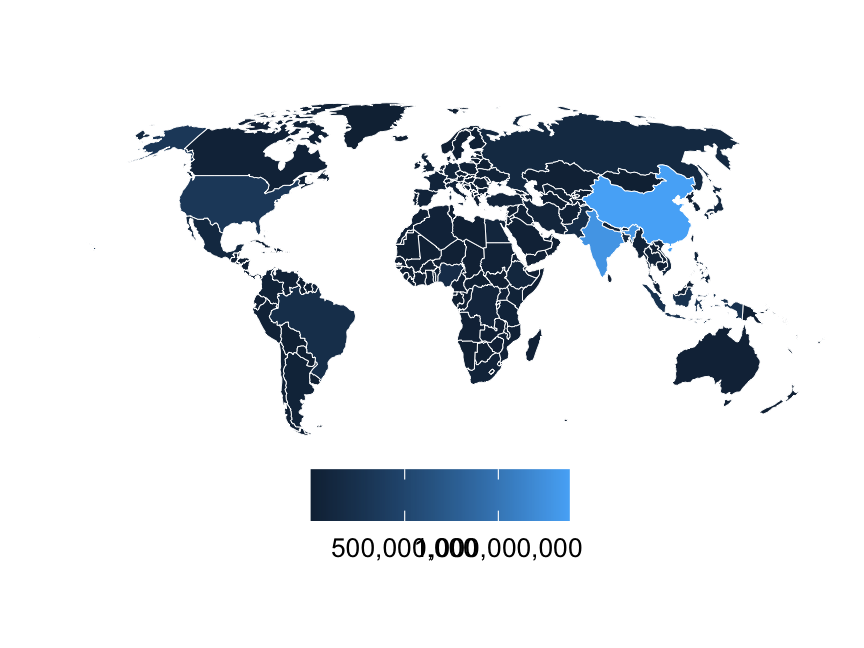
class: center middle main-title section-title-4 # Space .class-info[ **Session 12** .light[PMAP 8921: Data Visualization with R<br> Andrew Young School of Policy Studies<br> Summer 2021] ] --- name: outline class: title title-inv-7 # Plan for today -- .box-4.medium.sp-after[Maps and truth] -- .box-2.medium.sp-after[Putting data on maps] -- .box-5.medium.sp-after[GIS in R with **sf**] --- layout: false name: maps-truth class: center middle section-title section-title-4 animated fadeIn # Maps and truth --- layout: true class: title title-4 --- # John Snow and 1854 cholera epidemic .pull-left.center[ <figure> <img src="img/12/800px-John_Snow.jpg" alt="John Snow" title="John Snow" width="60%"> <figcaption>This Jo(h)n Snow knows things</figcaption> </figure> ] -- .pull-left.center[ .box-inv-4[10% of the population of Soho died in a week (!!)] .box-inv-4[Miasma theory said it was because the air was bad] ] ??? https://en.wikipedia.org/wiki/John_Snow --- layout: false class: bg-full background-image: url("img/12/1092px-Snow-cholera-map-1.jpg") ??? https://commons.wikimedia.org/wiki/File:Snow-cholera-map-1.jpg --- layout: true class: title title-4 --- # The Broad Street pump .pull-left-wide.center[ <figure> <img src="img/12/Snow-cholera-map.jpg" alt="John Snow's 1854 cholera map" title="John Snow's 1854 cholera map" width="68%"> </figure> ] .pull-left-narrow[ <figure> <img src="img/12/John_Snow_memorial_and_pub.jpg" alt="The Broad Street Pump" title="The Broad Street Pump" width="100%"> </figure> ] ??? https://nl.wikibooks.org/wiki/Bestand:Snow-cholera-map.jpg https://upload.wikimedia.org/wikipedia/commons/c/cb/John_Snow_memorial_and_pub.jpg --- # Outright lies .pull-left.center[ <figure> <img src="img/12/wp-bad-map.jpg" alt="Fake map" title="Fake map" width="90%"> </figure> ] -- .pull-right.center[ <figure> <img src="img/12/bad-map-meme.png" alt="Fake map again" title="Fake map again" width="70%"> </figure> ] ??? Bottom map doesn't even show crime rates—it's the results from the 2012 presidential election https://www.washingtonpost.com/news/fact-checker/wp/2016/11/16/no-the-viral-image-of-2016-election-results-and-2013-crime-rates-is-not-real/ https://me.me/i/electoral-map-2016-election-crime-rate-milo-democrats-are-as-3983235 --- # Fake maps and junk maps .pull-left.center[ <figure> <img src="img/12/bot-designed-maps.png" alt="Fast Company on bot-designed maps" title="Fast Company on bot-designed maps" width="80%"> <figcaption><a href="https://www.fastcompany.com/90230916/the-next-great-fake-news-threat-bot-designed-maps" target="_blank">“The next great fake news threat? Bot-designed maps”</a></figcaption> </figure> ] -- .pull-right.center[ <figure> <img src="img/12/candy-map.jpg" alt="Favorite candy by state" title="Favorite candy by state" width="100%"> </figure> ] ??? https://www.fastcompany.com/90230916/the-next-great-fake-news-threat-bot-designed-maps https://www.reddit.com/r/funny/comments/dos6zx/finally_an_accurate_candy_map/ --- # Points can be useless .center[ <figure> <img src="img/12/heatmap.png" alt="xkcd population maps" title="xkcd population maps" width="42%"> </figure> ] ??? https://xkcd.com/1138/ --- # Choropleths can be great .center[ <figure> <img src="img/12/fall-foliage-2019.png" alt="2019 Fall foliage prediction map" title="2019 Fall foliage prediction map" width="65%"> <figcaption><a href="https://smokymountains.com/fall-foliage-map/" target="_blank">Smoky Mountains 2019 Fall Foliage Prediction Map</a></figcaption> </figure> ] ??? https://smokymountains.com/fall-foliage-map/ --- # Choropleths can distort .center[ <figure> <img src="img/12/white-house-framed-map.png" alt="White House framed map of election results" title="White House framed map of election results" width="37%"> </figure> ] ??? https://thehill.com/blogs/blog-briefing-room/332927-trump-will-hang-map-of-2016-election-results-in-the-white-house --- # Land doesn't vote .center[ <video controls> <source src="img/12/election-map.mp4" type="video/mp4"> </video> ] ??? https://demcastusa.com/2019/11/11/land-doesnt-vote-people-do-this-electoral-map-tells-the-real-story/ [Cryptic command](https://stackoverflow.com/questions/31781238/using-ffmpeg-to-convert-gif-to-mp4-output-doesnt-play-on-android) to convert gif to mp4: ```text ffmpeg -r 30 -i input.gif -movflags faststart -pix_fmt yuv420p -vf "scale=trunc(iw/2)*2:trunc(ih/2)*2" out.mp4 ``` --- # Cartograms .pull-left-3.center[ <figure> <img src="img/12/countymap3070384.png" alt="2016 map by county" title="2016 map by county" width="100%"> </figure> ] .pull-middle-3.center[ <figure> <img src="img/12/538-hexagon-cartogram.png" alt="FiveThirtyEight hex cartogram" title="FiveThirtyEight hex cartogram" width="100%"> </figure> ] .pull-right-3.center[ <figure> <img src="img/12/countycart30701024.png" alt="2016 cartogram by county" title="2016 cartogram by county" width="100%"> </figure> ] ??? http://metrocosm.com/election-2016-map-3d/ --- layout: false class: bg-full background-image: url("img/12/Election2015_WinnerChangeMaps.jpg") ??? http://www.viewsoftheworld.net/?p=4570 --- .center[ <figure> <img src="img/12/2016_election_map_large.png" alt="xkcd 2016 election map" title="xkcd 2016 election map" width="70%"> </figure> ] ??? https://xkcd.com/1939/ --- layout: true class: title title-4 --- # Projections .box-inv-4.medium[[Animated world projections](https://bl.ocks.org/mbostock/raw/3711652/)] ??? Disable my video so OBS is happy --- # World projections <img src="12-slides_files/figure-html/projections-1.png" width="100%" style="display: block; margin: auto;" /> --- # US projections <img src="12-slides_files/figure-html/us-projections-1.png" width="100%" style="display: block; margin: auto;" /> --- # Finding projection codes .box-inv-4[[spatialreference.org](https://spatialreference.org/ref/epsg/)] .box-inv-4[[epsg.io](https://epsg.io/)] .box-inv-4[[proj.org](https://proj.org/operations/projections/index.html)] -- .box-inv-4[Most common ones listed on the<br>[course website example page](/example/12-example/)] -- .box-inv-4.small[[This](https://www.earthdatascience.org/courses/earth-analytics/spatial-data-r/understand-epsg-wkt-and-other-crs-definition-file-types/) is an excellent overview of how this all works] .box-inv-4.small[And [this](https://web.archive.org/web/20200225021219/https://www.nceas.ucsb.edu/~frazier/RSpatialGuides/OverviewCoordinateReferenceSystems.pdf) is a really really helpful overview of all these moving parts] --- # Which projection is best? -- .box-inv-4.medium[None of them] -- .box-4[There are no good or bad projections] -- .box-4[There are appropriate and<br>inappropriate projections] -- .box-inv-4.small[(but also ew mercator)] --- layout: false name: data-on-maps class: center middle section-title section-title-2 animated fadeIn # Putting data on maps --- layout: true class: title title-2 --- # Maps with lines .center[ <figure> <img src="img/12/CA_Migration_v2_101-01.png" alt="Net migration between California and other states" title="Net migration between California and other states" width="55%"> <figcaption><a href="https://www.census.gov/dataviz/visualizations/051/" target="_blank">US Census Bureau: Net migration between California and other states</a></figcaption> </figure> ] ??? https://www.census.gov/dataviz/visualizations/051/ --- # Maps with lines .center[ <figure> <img src="img/12/wind-map.png" alt="hint.fm wind map from Hurricane Sandy in 2012" title="hint.fm wind map from Hurricane Sandy in 2012" width="85%"> <figcaption><a href="http://hint.fm/wind/index.html" target="_blank">hint.fm Live Wind Map</a></figcaption> </figure> ] ??? http://hint.fm/wind/index.html --- layout: false class: bg-full background-image: url("img/12/streams-lakes-bw-100-w-01.jpg") ??? https://kieranhealy.org/prints/rivers/ --- layout: true class: title title-2 --- # Maps with points .center[ <figure> <img src="img/12/7840356344_c8dda52c31_h.jpg" alt="Every hurricane since 1851, by IDV solutions" title="Every hurricane since 1851, by IDV solutions" width="70%"> <figcaption><a href="https://www.flickr.com/photos/idvsolutions/7840356344/" target="_blank">Every hurricane since 1851, by IDV solutions</a></figcaption> </figure> ] ??? https://www.flickr.com/photos/idvsolutions/7840356344/ --- # Maps with points .center[ <figure> <img src="img/12/nyt-la-vaccinations.png" alt="NYT LA vaccinations" title="NYT LA vaccinations" width="90%"> <figcaption><a href="https://www.nytimes.com/interactive/2015/02/06/us/california-measles-vaccines-map.html" target="_blank">The New York Times, "Vaccination Rates for Every Kindergarten in California</a></figcaption> </figure> ] ??? https://www.nytimes.com/interactive/2015/02/06/us/california-measles-vaccines-map.html --- # Maps with points .center[ <figure> <img src="img/12/dc-photo-locations-small.jpg" alt="DC photo locations by locals and tourists" title="DC photo locations by locals and tourists" width="48%"> <figcaption><a href="https://www.flickr.com/photos/walkingsf/4672195208/in/album-72157624209158632/" target="_blank">Locals vs. tourists in DC (blue = locals; red = tourists; yellow = unknown)</a></figcaption> </figure> ] ??? https://www.flickr.com/photos/walkingsf/4672195208/in/album-72157624209158632/ --- # Voronoi maps .pull-left.center[ <figure> <img src="img/12/voronoi-states.png" alt="Voronoi state boundaries" title="Voronoi state boundaries" width="100%"> <figcaption><a href="http://vizual-statistix.tumblr.com/post/48625446909/these-are-voronoi-maps-of-the-contiguous-usa" target="_blank">Voroni state boundaries, by Seth Kadish</a></figcaption> </figure> ] -- .pull-right.center[ <figure> <img src="img/12/voronoi-nba.png" alt="Voronoi state boundaries" title="Voronoi state boundaries" width="100%"> <figcaption><a href="https://www.reddit.com/r/nba/comments/27got5/which_team_is_closest_to_you_a_voronoi_diagram/" target="_blank">Closest NBA teams</a></figcaption> </figure> ] ??? http://vizual-statistix.tumblr.com/post/48625446909/these-are-voronoi-maps-of-the-contiguous-usa https://www.reddit.com/r/nba/comments/27got5/which_team_is_closest_to_you_a_voronoi_diagram/ --- # Maps with shapes .center[ <figure> <img src="img/12/nyt-aca-map.png" alt="NYT: States Where Insured Could Renew Plans Before Change by Obama" title="NYT: States Where Insured Could Renew Plans Before Change by Obama" width="70%"> </figure> ] ??? https://archive.nytimes.com/www.nytimes.com/interactive/2013/11/20/us/which-states-will-allow-old-health-policies-to-be-renewed.html --- # Small multiples that look like maps .center[ <figure> <img src="img/08/geofacet.png" alt="geofacet package" title="geofacet package" width="65%"> <figcaption><code>facet_geo()</code> in the <a href="https://hafen.github.io/geofacet/" target="_blank"><strong>geofacet</strong> package</a></figcaption> </figure> ] --- layout: false name: gis-sf class: center middle section-title section-title-5 animated fadeIn # GIS in R with **sf** --- layout: true class: title title-5 --- # Shapefiles .box-5[Geographic information is shared as **shapefiles**] -- .box-inv-5[These are *not* like regular single CSV files!] -- .box-inv-5[Shapefiles come as zipped files with<br>a bunch of different files inside] .center[ <figure> <img src="img/12/shapefile-raw.png" alt="Shapefile folder structure" title="Shapefile folder structure" width="30%"> </figure> ] --- # Structure of a shapefile .small-code[ ```r library(sf) world_shapes <- read_sf("data/ne_110m_admin_0_countries/ne_110m_admin_0_countries.shp") ``` ``` ## Simple feature collection with 7 features and 3 fields ## Geometry type: MULTIPOLYGON ## Dimension: XY ## Bounding box: xmin: -180 ymin: -18 xmax: 180 ymax: 83 ## Geodetic CRS: WGS 84 ## # A tibble: 7 x 4 ## TYPE GEOUNIT ISO_A3 geometry ## <chr> <chr> <chr> <MULTIPOLYGON [°]> ## 1 Sovereign … Fiji FJI (((180 -16, 180 -17, 179 -17, 179 -17, 179 -17, 179 … ## 2 Sovereign … Tanzania TZA (((34 -0.95, 34 -1.1, 38 -3.1, 38 -3.7, 39 -4.7, 39 … ## 3 Indetermin… Western Sahara ESH (((-8.7 28, -8.7 28, -8.7 27, -8.7 26, -12 26, -12 2… ## 4 Sovereign … Canada CAN (((-123 49, -123 49, -125 50, -126 50, -127 51, -128… ## 5 Country United States … USA (((-123 49, -120 49, -117 49, -116 49, -113 49, -110… ## 6 Sovereign … Kazakhstan KAZ (((87 49, 87 49, 86 48, 86 47, 85 47, 83 47, 82 46, … ## 7 Sovereign … Uzbekistan UZB (((56 41, 56 45, 59 46, 59 46, 60 45, 61 44, 62 44, … ``` ] --- # Where to find shapefiles -- .box-inv-5[[Natural Earth](https://www.naturalearthdata.com/) for international maps] -- .box-inv-5.sp-after[[US Census Bureau](https://www.census.gov/geographies/mapping-files/time-series/geo/carto-boundary-file.html) for US maps] -- .box-inv-5[For anything else…] -- .center[ <figure> <img src="img/12/shapefile-search.png" alt="Search for shapefiles" title="Search for shapefiles" width="50%"> </figure> ] --- # Scales .pull-left-3[ <figure> <img src="img/12/download_thumbs_10m.jpg" alt="10m scale" title="10m scale" width="100%"> </figure> .box-inv-5.small[1:10m = 1:10,000,000] .box-inv-5.small[1 cm = 100 km] ] .pull-middle-3[ <figure> <img src="img/12/download_thumbs_50m.jpg" alt="50m scale" title="50m scale" width="100%"> </figure> .box-inv-5.small[1:50m = 1:50,000,000] .box-inv-5.small[ 1cm = 500 km] ] .pull-right-3[ <figure> <img src="img/12/download_thumbs_110m.jpg" alt="110m scale" title="110m scale" width="100%"> </figure> .box-inv-5.small[1:110m = 1:110,000,000] .box-inv-5.small[1 cm = 1,100 km] ] -- .box-inv-5[Using too high of a resolution<br>makes your maps slow and huge] --- # Latitude and longitude <img src="12-slides_files/figure-html/lat-long-example-1.png" width="504" style="display: block; margin: auto;" /> --- # The magic `geometry` column .box-inv-5[As long as you have a magic `geometry` column,<br>**all you need** to do to plot maps is `geom_sf()`] .left-code[ ```r ggplot() + geom_sf(data = world_shapes) ``` ] .right-plot[  ] --- # The magic `geometry` column .box-inv-5[Use `coord_sf()` to change projections] .left-code[ ```r ggplot() + geom_sf(data = world_shapes) + coord_sf(crs = "+proj=merc") ``` ] .right-plot[  ] --- # The magic `geometry` column .box-inv-5[Use `coord_sf()` to change projections] .left-code[ ```r ggplot() + geom_sf(data = world_shapes) + coord_sf(crs = "+proj=robin") ``` ] .right-plot[  ] --- # Use aesthetics like normal .box-inv-5[All regular ggplot layers and aesthetics work] .left-code[ ```r ggplot() + geom_sf(data = world_shapes, aes(fill = POP_EST), color = "white", size = 0.15) + coord_sf(crs = "+proj=robin") + scale_fill_gradient(labels = scales::comma) + labs(fill = NULL) + theme_void() + theme(legend.position = "bottom") ``` ] .right-plot[  ] --- # No `geometry` column? .box-inv-5[Make your own with `st_as_sf()`] .pull-left-narrow.small-code[ ```r other_data ``` ``` ## # A tibble: 2 x 3 ## city long lat ## <chr> <dbl> <dbl> ## 1 Atlanta -84.4 33.8 ## 2 Washington, DC -77.1 38.9 ``` ] -- .pull-right-wide.small-code[ ```r other_data %>% st_as_sf(coords = c("long", "lat"), crs = st_crs("EPSG:4326")) ``` ``` ## Simple feature collection with 2 features and 1 field ## Geometry type: POINT ## Dimension: XY ## Bounding box: xmin: -84 ymin: 34 xmax: -77 ymax: 39 ## Geodetic CRS: WGS 84 ## # A tibble: 2 x 2 ## city geometry ## * <chr> <POINT [°]> ## 1 Atlanta (-84 34) ## 2 Washington, DC (-77 39) ``` ] --- # **sf** is for all GIS stuff -- .box-inv-5[Draw maps] -- .box-inv-5[Calculate distances between points] -- .box-inv-5[Count observations in a given area] -- .box-inv-5.sp-after[Anything else related to geography!] -- .box-inv-5[See [here](https://bookdown.org/robinlovelace/geocompr/intro.html) or [here](https://bookdown.org/lexcomber/brunsdoncomber2e/Ch5.html) for full textbooks] --- # `geom_sf()` is today’s standard .box-inv-5[You'll sometimes find older tutorials and StackOverflow answers about using `geom_map()` or **ggmap** or other things] -- .box-inv-5.sp-after[Those still work, but they don't use the same magical **sf** system with easy-to-convert projections and other GIS stuff] -- .box-5.medium[Stick with **sf** and `geom_sf()`<br>and your life will be easy]